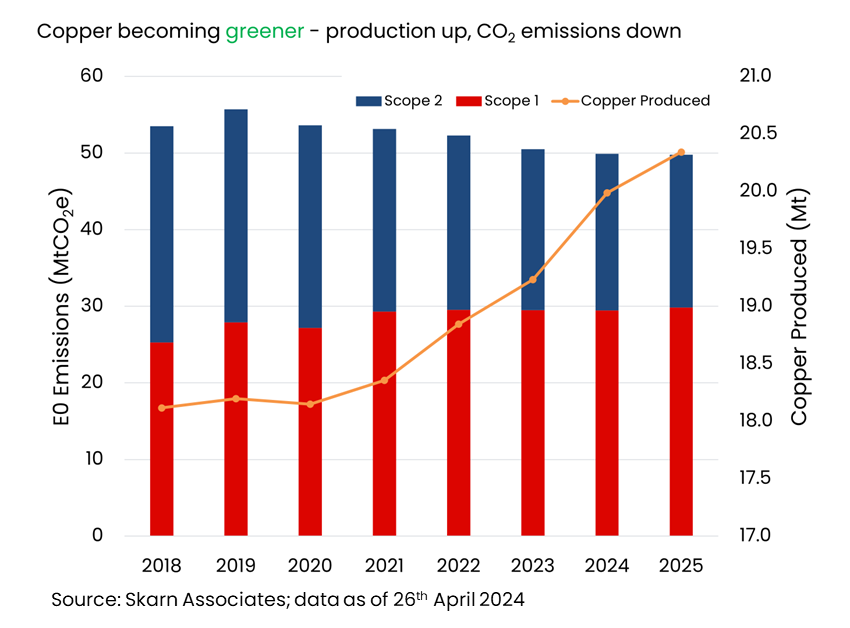
Global copper production covered in Skarn’s dataset rose by 378kt in 2023, with a simultaneous cut in total E0 (direct and indirect emissions at the minesite) emissions by 5.3% versus 2022. Total minesite Scope 1 and 2 emissions allocated to copper fell by 1.8 million tonnes CO2e. This decrease in E0 continues a trend seen over recent years, driven almost entirely by reductions in Scope 2 emissions (down 1.7 million tonnes from 2022 to 2023). Scope 1 emissions have not seen the same degree of reduction, however, falling only marginally over the 2022-2023 period (down 34.7kt CO2e). This year we expect both direct and indirect minesite emissions to fall in intensity by a combined 5%. As copper output continues to rise, we still expect to see reductions in emissions to 2026 as purchased electricity becomes cleaner and more power purchase agreements (PPAs) come into effect. Additionally, PPAs that expire in the next few years could be extended or improved to include larger quantities of clean energy.

The primary driver of falling emissions in 2023 was the utilisation of PPAs by miners to reduce their Scope 2 emissions. Total emissions fell despite the consumption of purchased electricity increasing. Purchased electricity is roughly 85% of all minesite electricity consumption – the balance being self-generated. This fall in Scope 2 intensity is a consistent trend seen since 2018, forecast to continue till at least 2025. Scope 2 intensity currently sits at around 30% lower than baseline data for 2018.

There are several explanations for Scope 2 decreasing. Firstly, many companies have signed PPAs with electricity companies for clean energy, either to cover their total electricity usage or for a substantial proportion of it. A notable example is Boliden signing a PPA with Agder Energi to provide clean energy to their Finnish and Swedish assets for 15 years from 2022. Anglo American signed a similar agreement with Engie Energia Peru to provide 100% renewable electricity for its Peruvian operation, Quellaveco, reducing its Scope 2 emissions from 97kt in 2022 to zero in 2023. KGHM signed a PPA back in November 2020 with AES Andes to begin supplying renewable energy to its Sierra Gorda operation in Chile. The agreement was initially set out to provide 40% of the mine’s electricity. This reached 100% in January of 2023, eliminating all Scope 2 emissions.

Secondly miners have either implemented some renewable power generation capability onsite, such as solar or wind, or are looking to do so in the coming years. For example, IGO’s Nova mine has solar capacity onsite, reducing the need for electricity from the grid. In 2023, it is estimated that solar generated 4.5% of the direct energy required. Looking forward to this year, a solar plant at the Proyecto Riotinto site in Spain is currently on schedule for completion in late 2024. Once fully operational this plant will provide 22% of the mine’s total energy needs, whilst reducing indirect CO2e emissions by over 40,000 tonnes per year.
Additionally, moves from operators to report market-based Scope 2 data is, in some cases, showing a demonstratable reduction in indirect emissions. Market-based emissions factors provide a truer picture of emissions from purchased power by incorporating the real mix of generating methods from a supplier, including renewable energy. Location-based emissions factors provide an average for a country/region and are likely to miss out the granularity of the energy mix supplied to a mine. One example is K92’s Kainantu mine in Papua New Guinea, where the company reports both location and market-based Scope 2 emissions, which differ significantly. In 2022, market-based emissions were 3,546 tCO2e versus 13,327 tCO2e for location-based reporting, a difference of close to 75%. Dundee Precious Metals also reported market-based Scope 2 since 2022. Both of the company’s Bulgarian mining operations show markedly lower Scope 2 when reporting market versus location-based emissions. For Chelopech market-based emissions are 41,287 tCO2e, whereas the location-based number is 49,892 tCO2e, a difference of 17% in 2023. Similarly for Ada Tepe a difference of close to 50% is demonstrated by reporting market-based (9,288 tCO2e) over location-based (17,555 tCO2e) emissions.
The average emissions per MWh of electricity purchased by the copper industry have been falling steadily since our dataset began – an aggregate -8.1% CAGR to 2023. This trend is expected to continue through to 2025 where it begins to level out, as yet-to-come-into-operation power purchase agreements start operating. Electricity consumption has grown steadily year on year from 2018 to 2023, up by 17,000GWh over the period. The electricity consumed per tonne of ore processed has also increased over the same period (up 1.6 kWh/t), though the trend is clearly impacted by Covid-19 shutdowns during 2020 and 2021.

Compared with Scope 2, direct Scope 1 emissions have been somewhat more inelastic to the demands of decarbonisation. Two reasons why are the time scales involved, and the financial viability of solutions. Conversions of mining fleet away from diesel to technologies such as trolley-assist take many years to implement after determining feasibility and require substantial capital investment. In addition, equipment will be replaced as mining fleet nears its replacement age. As a result, such solutions are only really viable for assets with a sufficient life of mine to recoup the investment costs. In addition, the technological innovation required to replace large diesel mobile equipment with battery electric or hydrogen fuel cell power trains is still in the pre-commercialisation phase, with these items unlikely to be widely commercially available for a few years yet. For many mines approaching depletion and closure, Scope 1 mitigation strategies may not be viable or beneficial.
In conclusion, E0 emissions for copper are being reduced solely by decreases in Scope 2. No discernible change in Scope 1 emissions is yet evident from the data, and this picture looks to continue to at least 2030. The continuing decrease in Scope 2 is indicative of the world’s electricity generating capacity becoming cleaner, switching out high intensity fossil fuel sources for renewable energy, and the securing of some of that renewable power by the mining industry. The unfortunate impact of the latter is that those renewable power MWh units are no longer available to other consumers, raising the average carbon intensity outside of the mining sector at the same time.
MORE FROM SKARN
About Us
Skarn Associates is the market leader in quantifying and benchmarking asset-level greenhouse gas emissions, energy intensity, and water use across the mining sector.
Latest bulletin