Our E0 & E1 Metrics
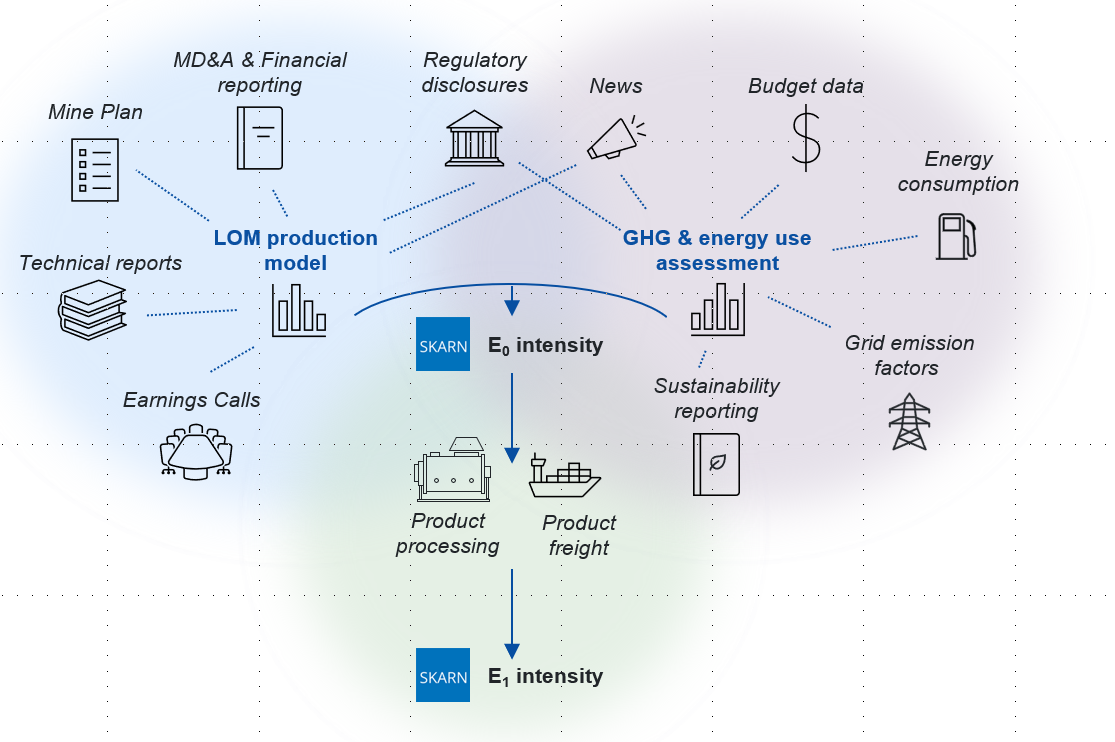
The second stage of producing the DCF model would be to then look at the capital and operating costs of the asset, and to model them out year-by-year. Instead of producing the costs side of such a DCF model, Skarn marries the LOM plan with a year-by-year analysis of energy inputs and other relevant data to put together an assessment of the GHG emissions per year for a property. For the majority of it’s work analysing mine site emissions, Skarn utilises economic allocation of emissions between the produced commodities at each mine site. In this way, very different mines with different revenue drivers and process routes can be compared on a similar basis to one another. Skarn’s data is used to interrogate industry supply chains and compare performance. Every company and every asset is unique, either in terms of process method, product mix, infrastructure, location and geology. Our standard processes enable comparison between entities reporting different statistics to different degrees of granularity.

Similar to production data, our GHG and energy data is based on data reported by companies. We first seek to understand the fuels and sources of power for the site whether generated onsite or purchased. While many producers release GHG and Energy reports based on internationally recognized standards, there can be a degree of variability in how those, valid, figures are presented, if figures are provided at all. Each site is modelled individually whether data is provided on a site or corporate level. Sites with no emissions data can often have their data calculated up from technical reporting, for example, installed equipment and power draws to quantify energy requirements, or budgeted diesel spend and price assumptions to calculate the modelled diesel use in the mine plan. We do not use regional or global averaged data.

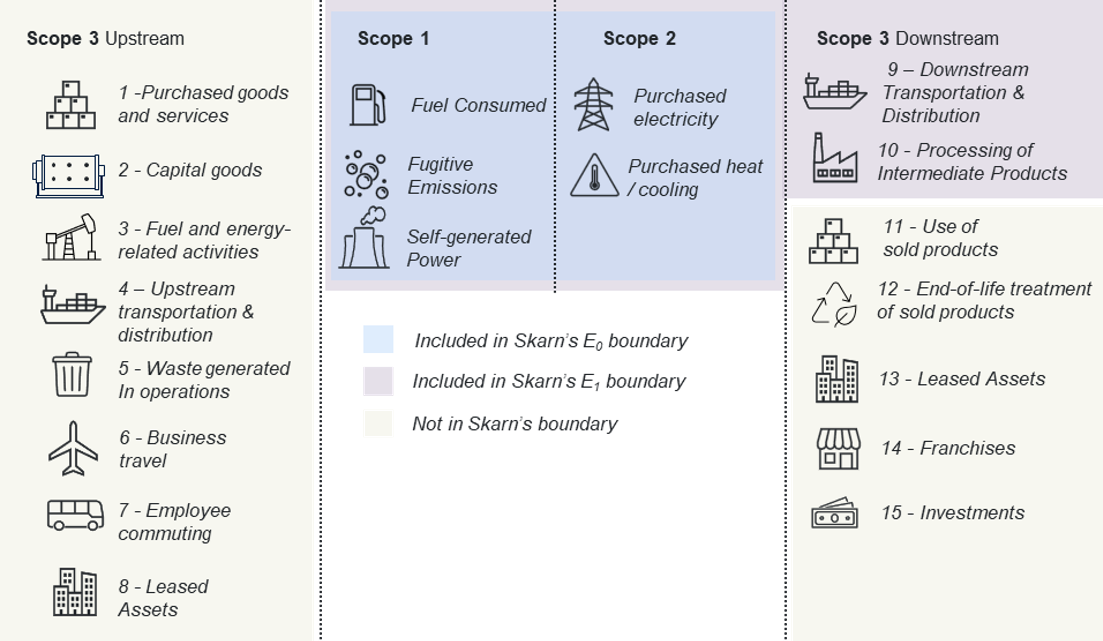
Skarn’s coverage includes all Scope 1 and 2 emissions associated with the mining asset. Also included is the transport of intermediate products (e.g.: copper concentrate) and their processing to 1st saleable products. These boundaries extend from the minesite through to the metal refinery, and the components of E0 and E1 can vary depending on the product and commodity. For mine GHG and Energy curves, E0 will cover the production of a concentrate or doré, while E1 will include transport of that product to a destination port and associated smelter & refiner transport and treatment to 1st saleable product. Transport from port to the smelter/refinery is included in the smelter/refinery intensity figures. For a smelter or refiner GHG and Energy Curves, E0 will cover smelting and refining of minesite concentrate or doré. It also includes the transport from the port, where applicable, to the smelter.
Skarn’s E0 and E1 metric are dependent on the activity being taken and the point in the value-chain of that activity. They are not directly comparable to the GHG protocol “Scopes” definition, since the Scopes delineate the ownership of emissions. Integrated miner/refiners will own the emissions from downstream smelting/refining under their Scope 1 & 2 reporting, while a company which owns its own transport fleet (e.g.: rail locomotives) will carry those emissions in their corporate Scope 1.